


Introduction to KNN (K-nearest neighbors)

Why use KNN?
Simple to understand and implement
Versatile: Can be used for regression and classification tasks (supervised learning) and clustering (non-supervised learning)
Intuition
Given a set of features, we can predict the target variable by looking at its K neighbors (1 <= K <=n, where n is the number of data points.


How it works:
Assign a value for K
Calculate the distance (usually Euclidean) between the new data point and all other existing data points (see below). Sort them in ascending order.
Find the K nearest neighbors to the new data point based on the calculated distances.
For classification tasks, assign the new data point to the majority class in the nearest neighbors. For regression tasks, find the average of the target variable in the nearest neighbors to find the predicted target value.
Activity 1: Classification using KNN by hand!
Reference: https://www.freecodecamp.org/news/k-nearest-neighbors-algorithm-classifiers-and-model-example/
Assume K = 5
Given that the new data point has a (brightness = 20, saturation = 35), calculate the Euclidean distance between the new data point and every other data point. Fill up the distance column in the table below.
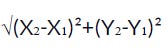
Euclidean distance formula 
New Data point 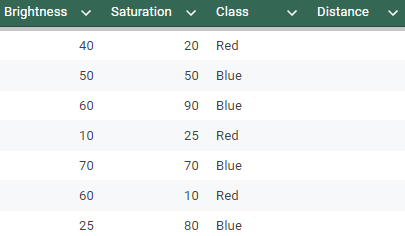
Current Dataset 3. Sort the points by distance in an ascending order.
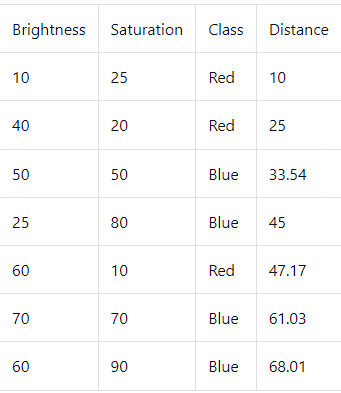
Sorted dataset by ascending distance 4. Since K = 5, we only look at the first 5 rows to predict the class of the new date point.
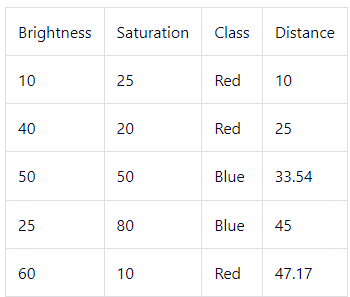
The nearest k = 5 neighbors


Since number of red classes(ie 3) is more than the number of blue classes (ie 2), the predicted class for our new data point (brightness = 20, saturation = 35) is RED!

Predicted class for new variable

How to find optimal value for K?
No easy way. Test for range of K to find out the optimal K that gives you the best prediction.
Most commonly used is k = 5
Note: If K is too small, it may lead to overfitting. If K is too large, it may lead to underfitting.